
10 Minutes Exploratory Data Analysis with 3 Python Libraries
10 Minutes Exploratory Data Analysis with 3 Python Libraries
Introduction
When I’m unfamiliar with the dataset and don’t know what to explore, I found seaborn.pairplot is useful to find relationship of the data, but actually there are various Exploratory Data Analysis (EDA) libraries, DataPrep, Pandas Profiling, and AutoViz are 3 popular ones.
I’m going to do a quick comparison of these libraries.
DataPrep
First of all, I need to install it in Jupyter Notebook (through Anaconda Navigator).
!conda install -y dataprep
Dataprep also provides online demo in Colab.
Import libraries
from dataprep.datasets import load_dataset
from dataprep.datasets import get_dataset_names
from dataprep.eda import create_report
import warnings
warnings.filterwarnings('ignore')

# list all datasets
get_dataset_names()
['house_prices_test',
 'adult',
 'countries',
 'patient_info',
 'waste_hauler',
 'iris',
 'titanic',
 'house_prices_train',
 'covid19',
 'wine-quality-red']
Load dataset
Here I choose the dataset wine-quality-red.
df = load_dataset("wine-quality-red")
df.head()
| fixed_acidity | volatile_acidity | citric_acid | residual_sugar | chlorides | free_sulfur_dioxide | total_sulfur_dioxide | density | pH | sulphates | alcohol | class | |
|---|---|---|---|---|---|---|---|---|---|---|---|---|
| 0 | 7.4 | 0.70 | 0.00 | 1.9 | 0.076 | 11.0 | 34.0 | 0.9978 | 3.51 | 0.56 | 9.4 | 5 |
| 1 | 7.8 | 0.88 | 0.00 | 2.6 | 0.098 | 25.0 | 67.0 | 0.9968 | 3.20 | 0.68 | 9.8 | 5 |
| 2 | 7.8 | 0.76 | 0.04 | 2.3 | 0.092 | 15.0 | 54.0 | 0.9970 | 3.26 | 0.65 | 9.8 | 5 |
| 3 | 11.2 | 0.28 | 0.56 | 1.9 | 0.075 | 17.0 | 60.0 | 0.9980 | 3.16 | 0.58 | 9.8 | 6 |
| 4 | 7.4 | 0.70 | 0.00 | 1.9 | 0.076 | 11.0 | 34.0 | 0.9978 | 3.51 | 0.56 | 9.4 | 5 |
Analyze dataset
report = create_report(df)
report
Pandas Profiling
from pandas_profiling import ProfileReport

profile = ProfileReport(df, title="Pandas Profiling Report")
profile
AutoViz
from autoviz.AutoViz_Class import AutoViz_Class
%matplotlib inline

AV = AutoViz_Class()
dft = AV.AutoViz(
    "",
    dfte = df
)
dft
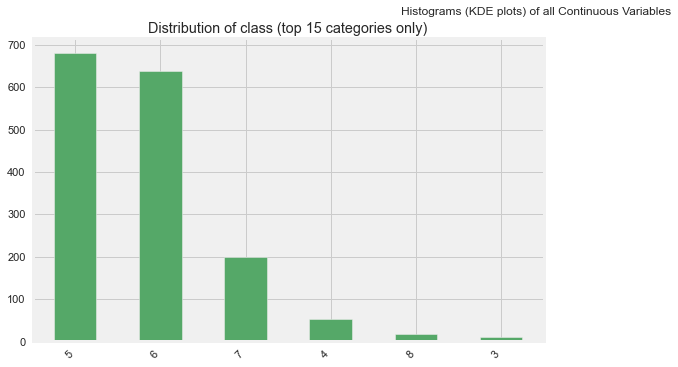
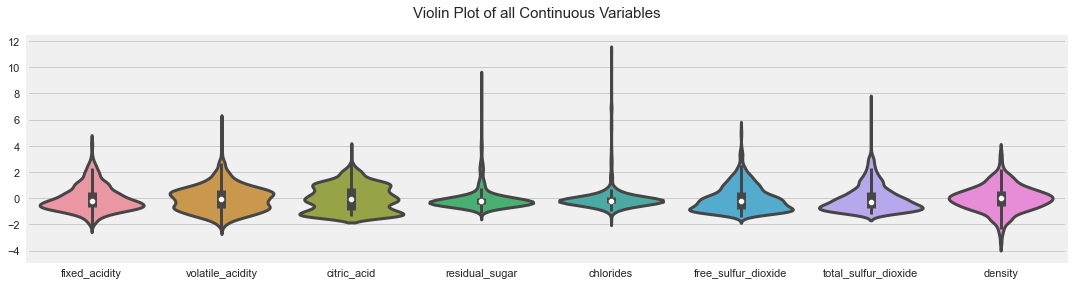
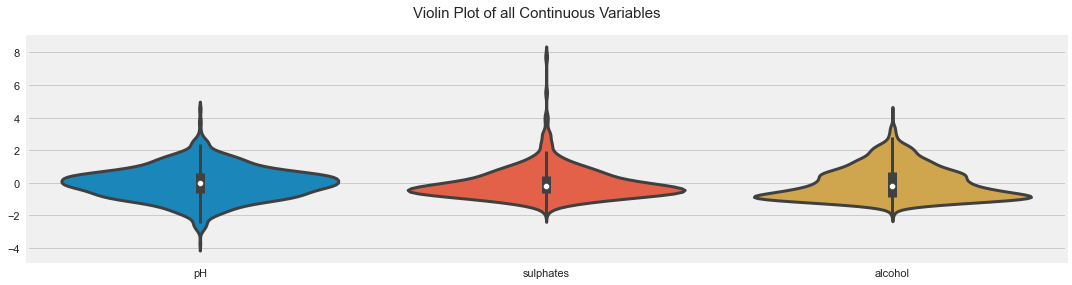
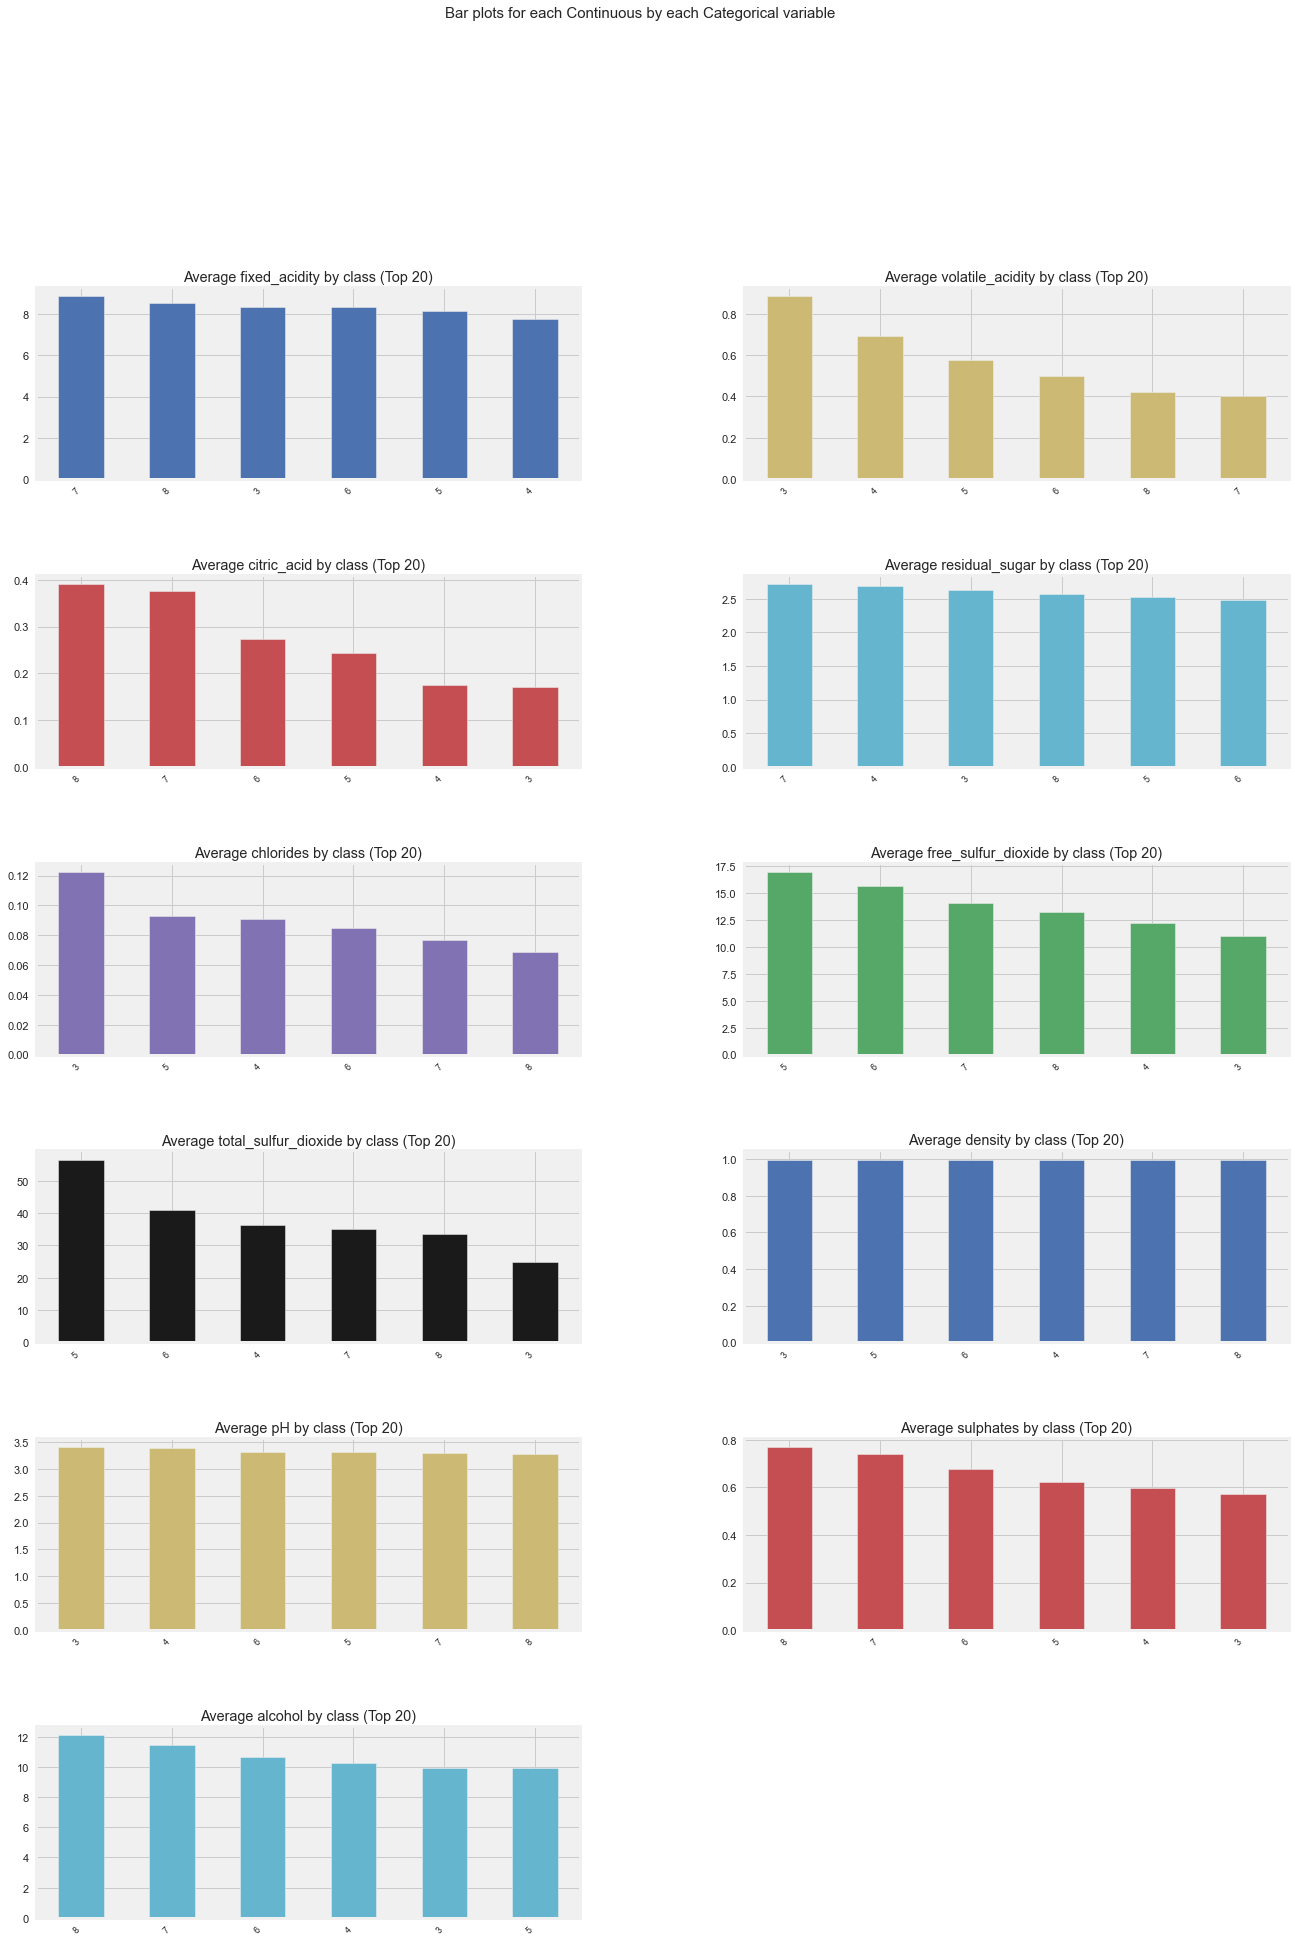
All Plots done
Time to run AutoViz = 21 seconds

 ###################### AUTO VISUALIZATION Completed ########################
| fixed_acidity | volatile_acidity | citric_acid | residual_sugar | chlorides | free_sulfur_dioxide | total_sulfur_dioxide | density | pH | sulphates | alcohol | class | |
|---|---|---|---|---|---|---|---|---|---|---|---|---|
| 0 | 7.4 | 0.700 | 0.00 | 1.9 | 0.076 | 11.0 | 34.0 | 0.99780 | 3.51 | 0.56 | 9.4 | 5 |
| 1 | 7.8 | 0.880 | 0.00 | 2.6 | 0.098 | 25.0 | 67.0 | 0.99680 | 3.20 | 0.68 | 9.8 | 5 |
| 2 | 7.8 | 0.760 | 0.04 | 2.3 | 0.092 | 15.0 | 54.0 | 0.99700 | 3.26 | 0.65 | 9.8 | 5 |
| 3 | 11.2 | 0.280 | 0.56 | 1.9 | 0.075 | 17.0 | 60.0 | 0.99800 | 3.16 | 0.58 | 9.8 | 6 |
| 4 | 7.4 | 0.700 | 0.00 | 1.9 | 0.076 | 11.0 | 34.0 | 0.99780 | 3.51 | 0.56 | 9.4 | 5 |
| ... | ... | ... | ... | ... | ... | ... | ... | ... | ... | ... | ... | ... |
| 1594 | 6.2 | 0.600 | 0.08 | 2.0 | 0.090 | 32.0 | 44.0 | 0.99490 | 3.45 | 0.58 | 10.5 | 5 |
| 1595 | 5.9 | 0.550 | 0.10 | 2.2 | 0.062 | 39.0 | 51.0 | 0.99512 | 3.52 | 0.76 | 11.2 | 6 |
| 1596 | 6.3 | 0.510 | 0.13 | 2.3 | 0.076 | 29.0 | 40.0 | 0.99574 | 3.42 | 0.75 | 11.0 | 6 |
| 1597 | 5.9 | 0.645 | 0.12 | 2.0 | 0.075 | 32.0 | 44.0 | 0.99547 | 3.57 | 0.71 | 10.2 | 5 |
| 1598 | 6.0 | 0.310 | 0.47 | 3.6 | 0.067 | 18.0 | 42.0 | 0.99549 | 3.39 | 0.66 | 11.0 | 6 |
1599 rows × 12 columns
seaborn.pairplot
Similarly, seaborn can also check the relationships between variables with method pairplot.
import seaborn as sns
import matplotlib.pyplot as plt

sns.pairplot(df, corner=True)
plt.show()
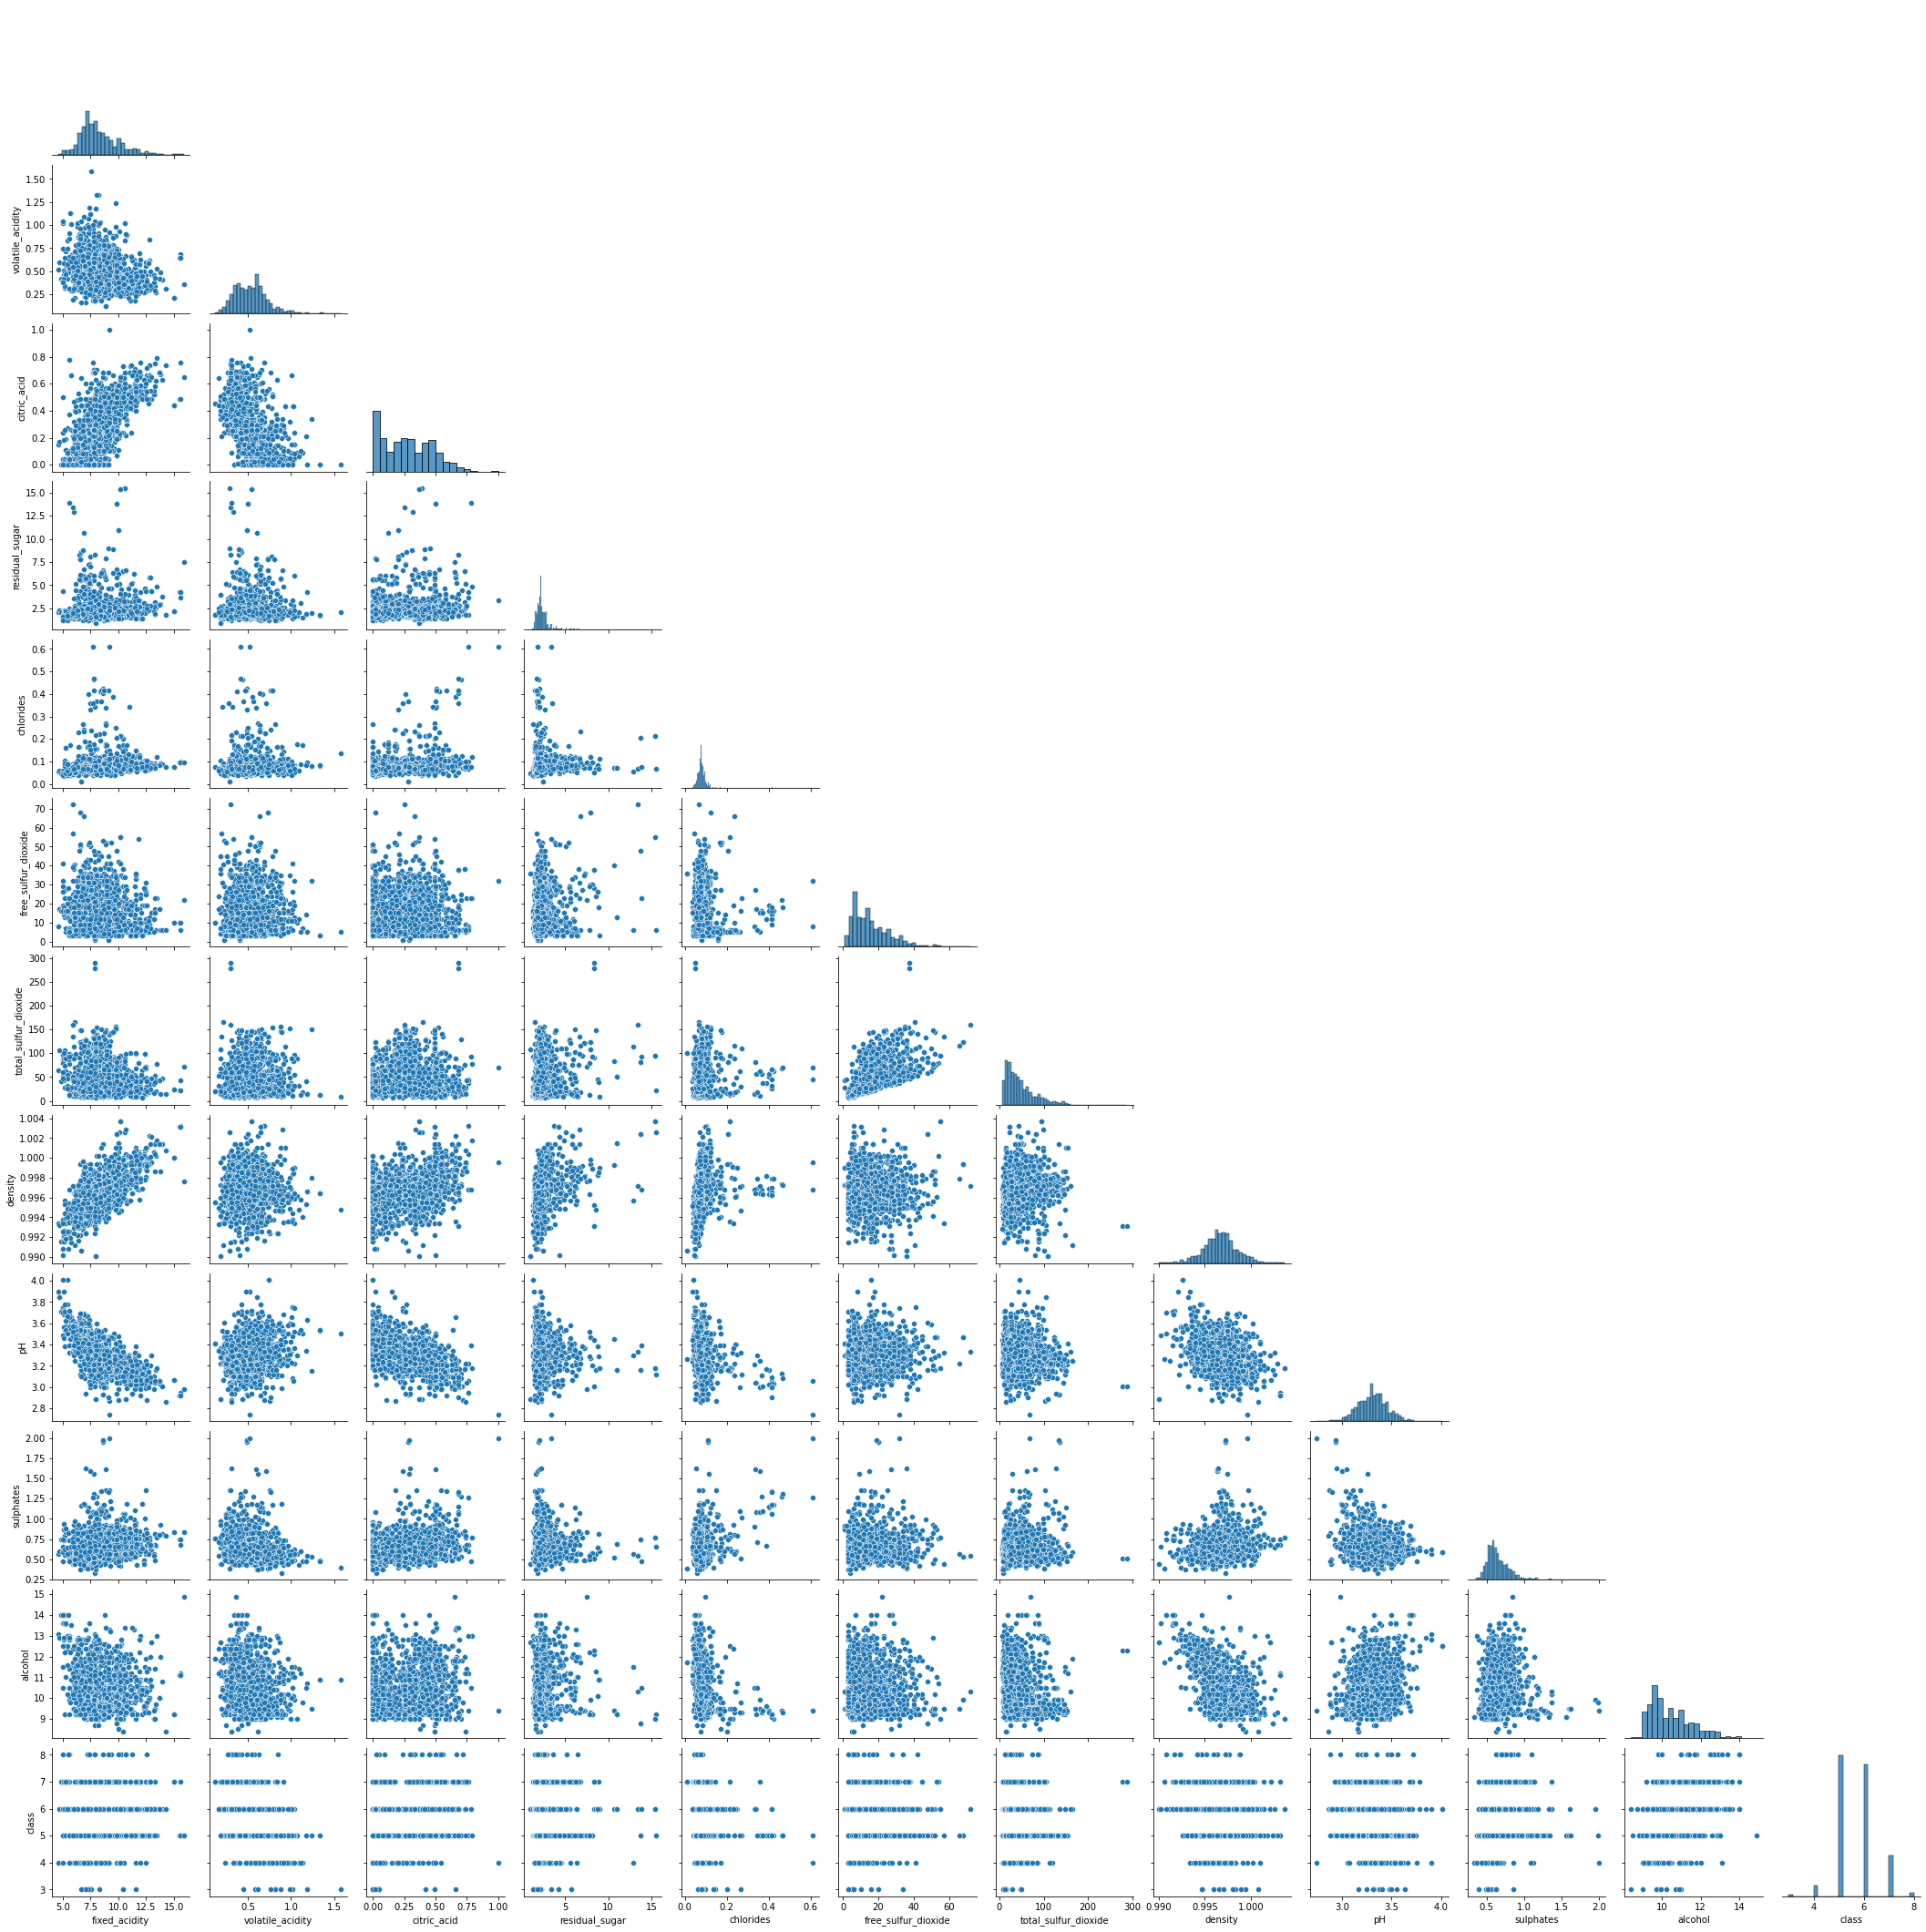
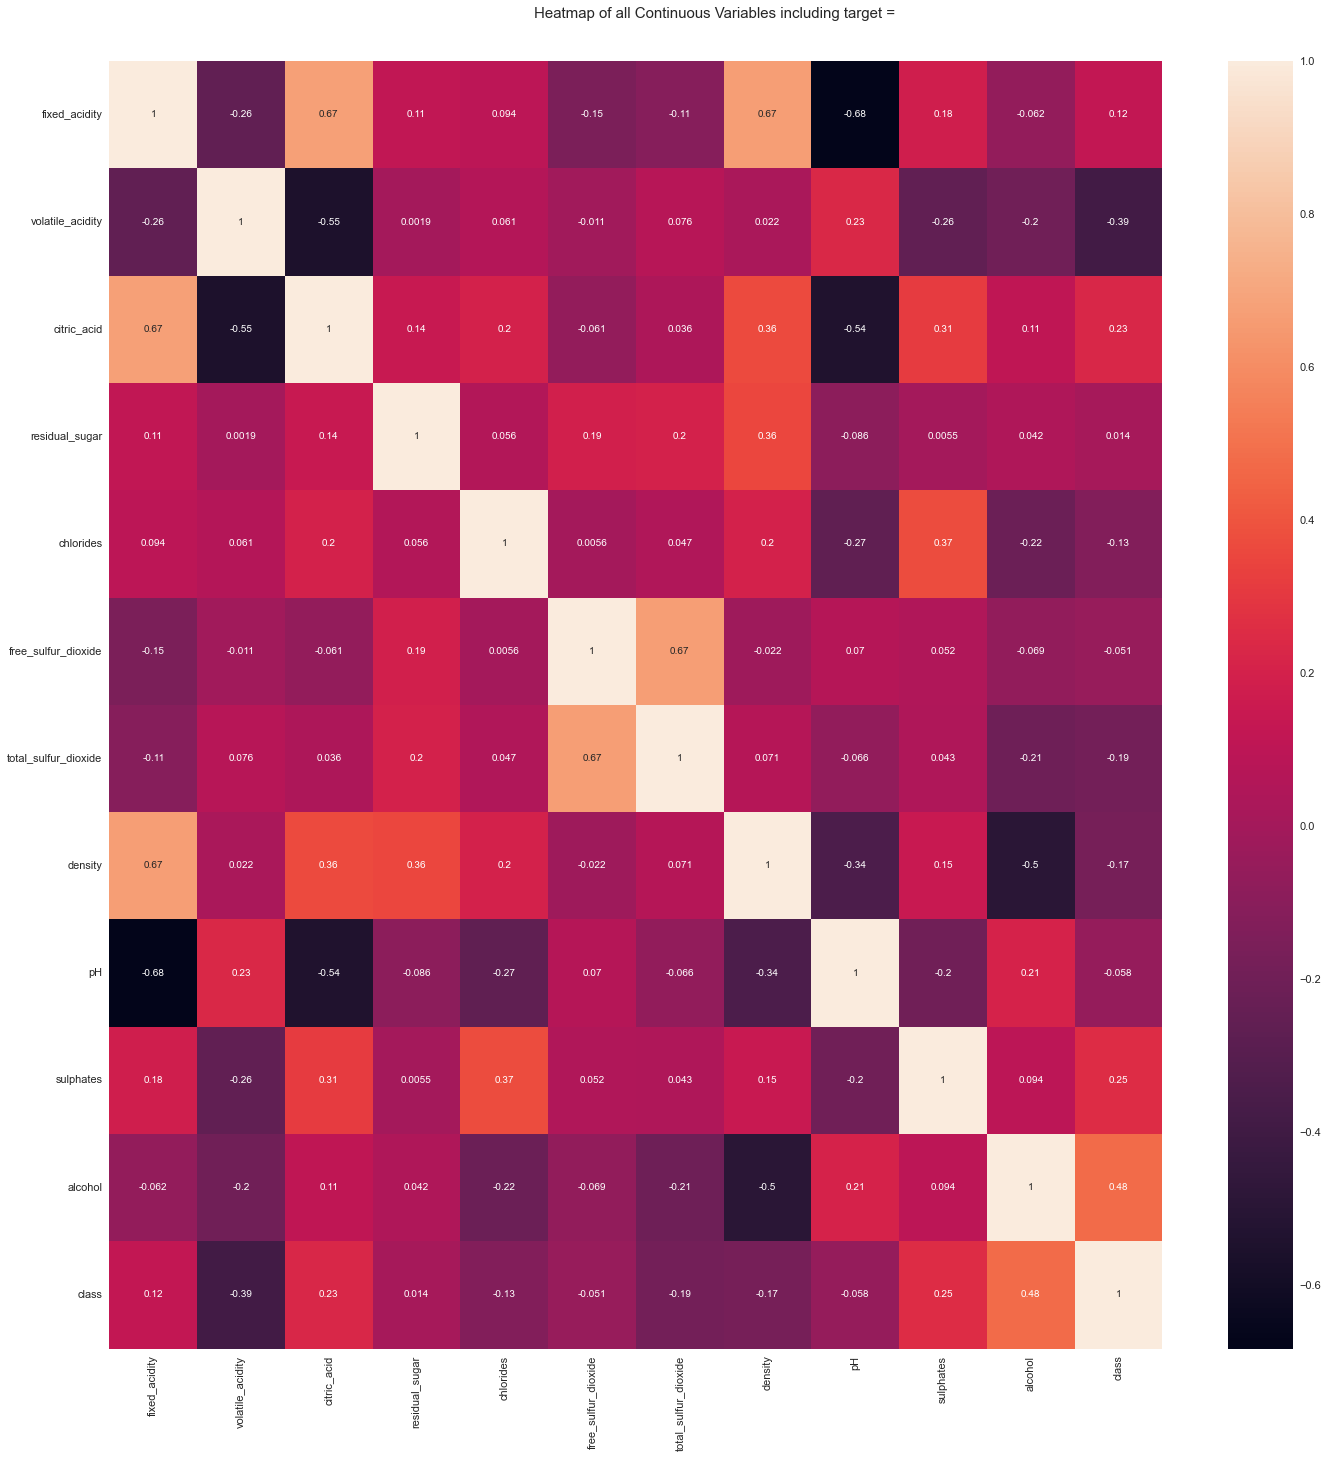
Some variables show strong correlations, such as citric_acid and fixed_acidity, density and fixed_acidity, etc., that’s the same as “Interactions” and “Correlations” of dataprep.
Conclusion
DataPrep, Pandas Profiling, and AutoViz, they are very similar in a extent. Both DataPrep and Pandas Profiling visualize missing values, that’s useful. Currently I prefer DataPrep because of its concise UI, especially the Interactions part.
I’m thinking about adding above libraries to create my self-defined functions to speed up the data analysis.